Note
Go to the end to download the full example code. or to run this example in your browser via Binder
Scatter plot of ternary problem in the simplex space
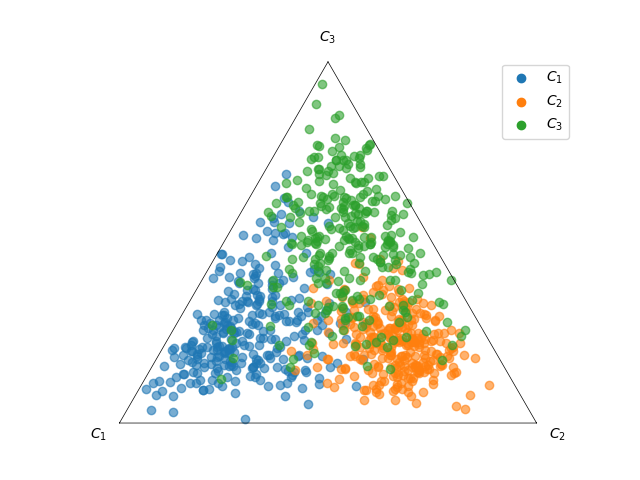
This example illustrates how to draw samples from the scores of a model and their true label.
# Author: Miquel Perello Nieto <miquel.perellonieto@bristol.ac.uk>
# License: new BSD

print(__doc__)
We generate 3 scores as comming from 3 Dirichlet distributions simulating the output scores of a classifier. Then we show how to draw the samples in the simplex space.
import matplotlib.pyplot as plt
import numpy as np
np.random.seed(42)

n_c1 = n_c2 = n_c3 = 300
p = np.concatenate((np.random.dirichlet([6, 2, 3], n_c1),
                    np.random.dirichlet([5, 12, 5], n_c2),
                    np.random.dirichlet([2, 3, 5], n_c3)
                   ))

y = np.concatenate((np.zeros(n_c1), np.ones(n_c2), np.ones(n_c3)*2))

from pycalib.visualisations.ternary import draw_tri_samples

fig, ax = draw_tri_samples(p, classes=y, alpha=0.6)

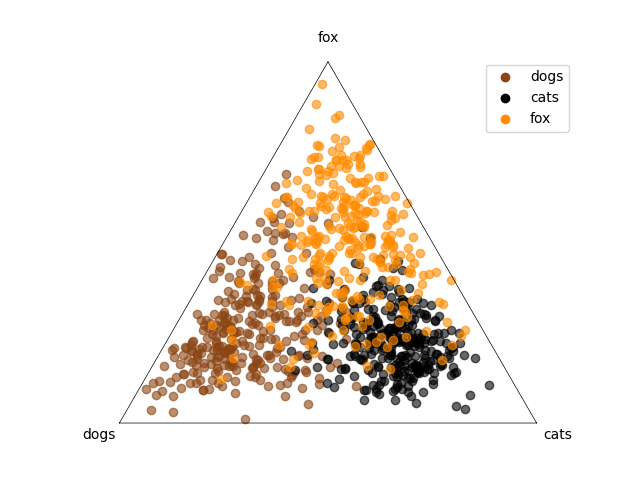
Here we specify the names of each class and change their colors.
fig, ax = draw_tri_samples(p, classes=y, alpha=0.6,
                           labels=['dogs', 'cats', 'fox'],
                           color_list=['saddlebrown', 'black', 'darkorange'])

Total running time of the script: (0 minutes 0.749 seconds)